Introduction

In Machine Learning, one essential step is evaluating the performance of a model. For classification models, the Confusion Matrix serves as a fundamental instrument for evaluating the performance. It provides a clear and visual summary of the prediction accuracy of a model by illustrating the correspondence between the predicted and actual classes. This visualization of the results of a machine learning model enables Data Scientists and Data Analysts to make decisions about model refinement and optimization. In this tutorial, we will explore the Confusion Matrix and explain its components and interpretation. We also look at a hands-on example of the Confusion Matrix.

What is a Confusion Matrix?

A Confusion Matrix can be used to evaluate the performance of classification models in Machine Learning. It consists of rows and columns representing the predicted and actual classes. The Confusion Matrix can have different dimensions based on the number of classes in the classification problem.

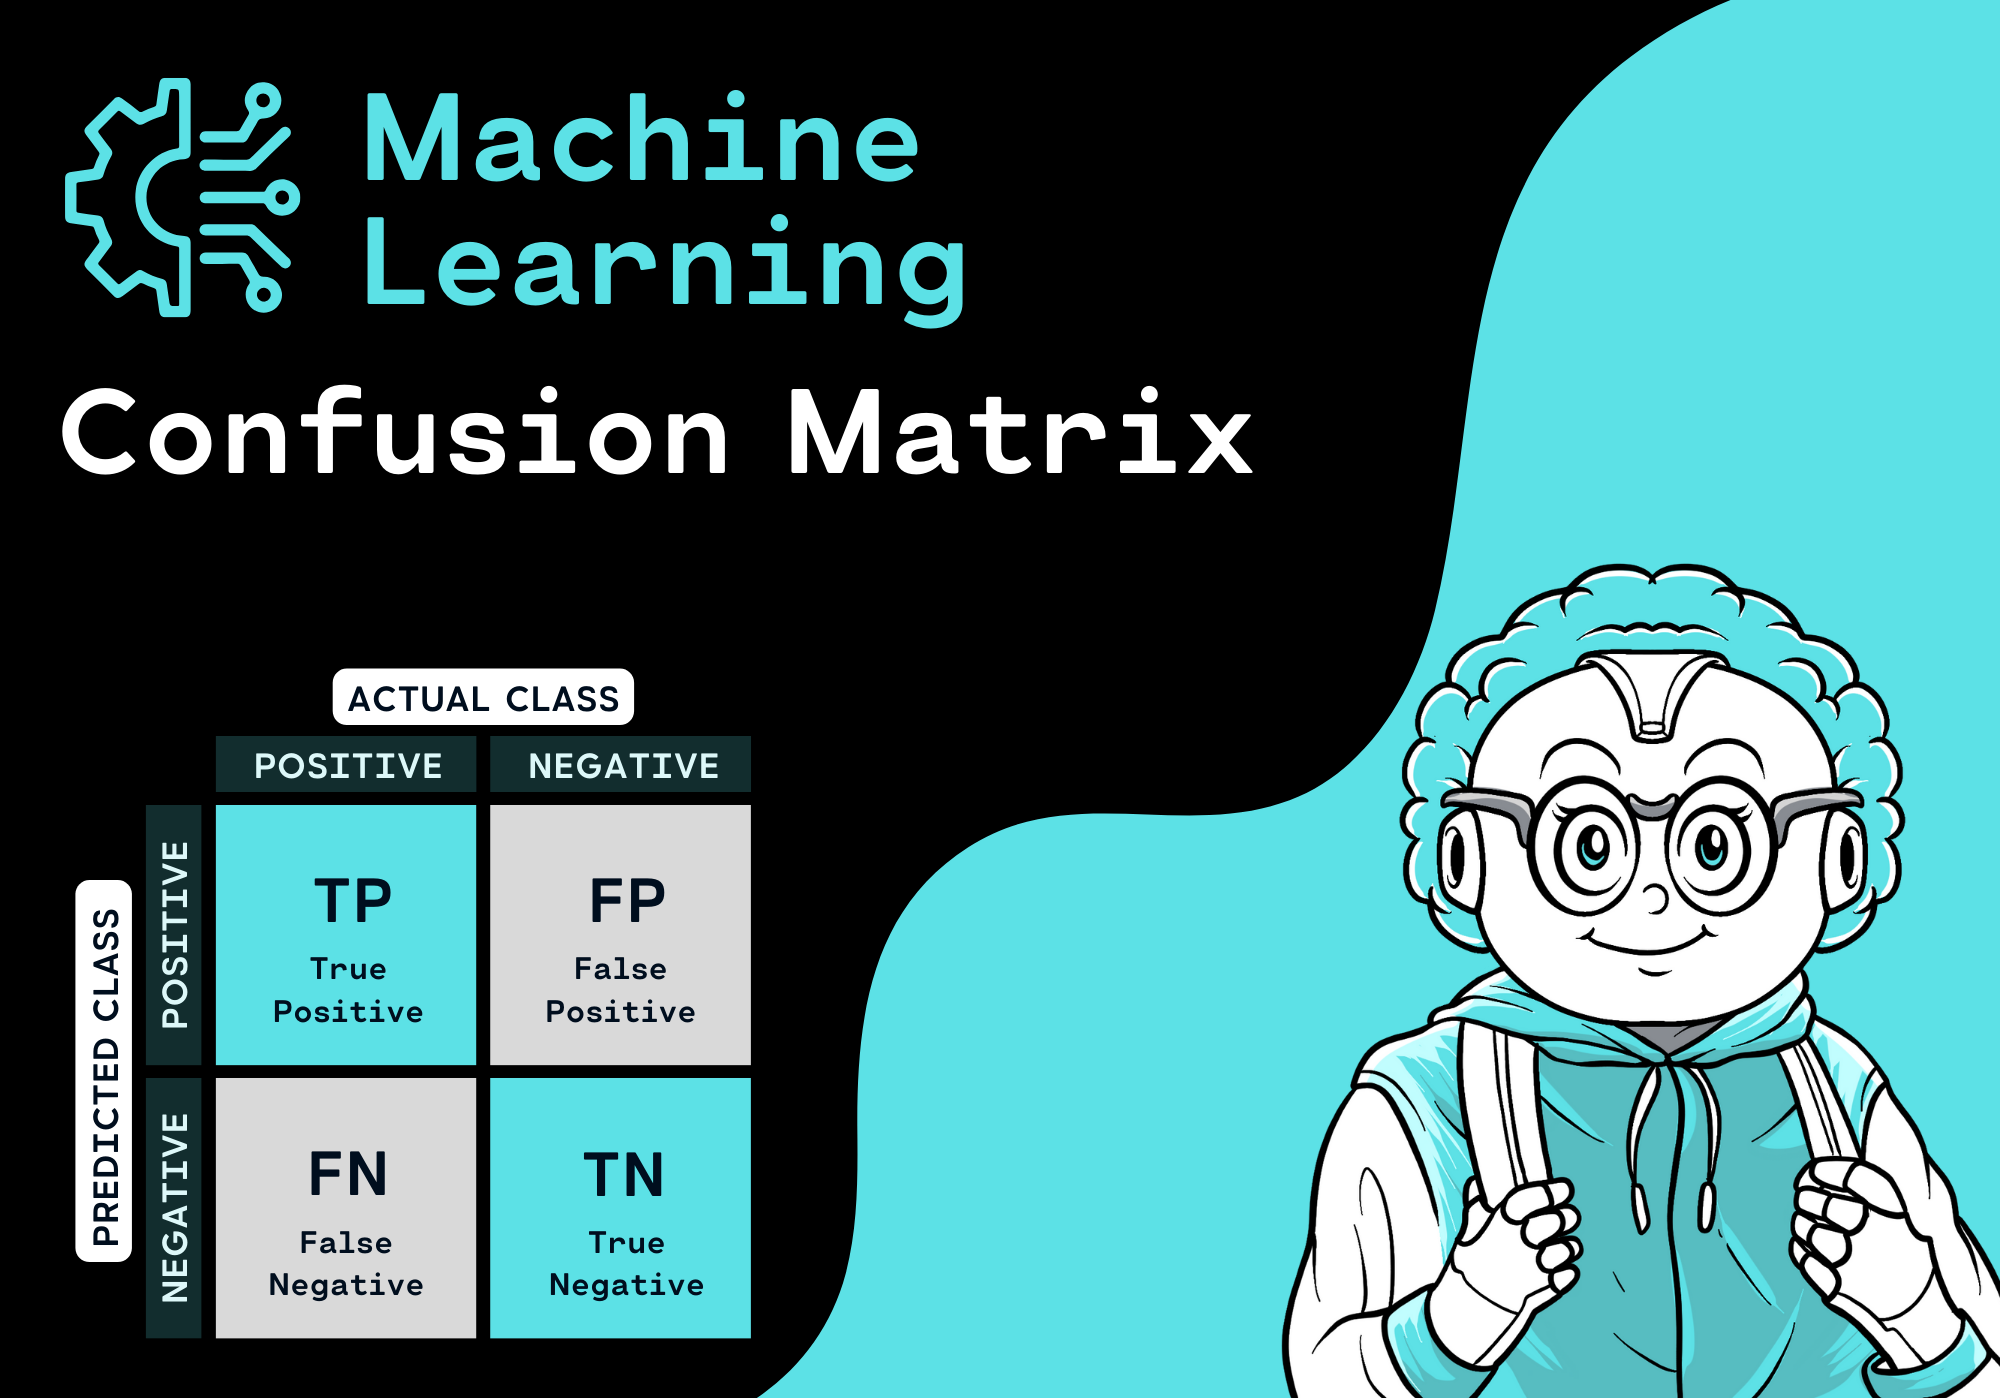
In the following, we assume a Machine Learning Model for Binary Classification. In this case there are two classes, so the Confusion Matrix is a 2x2 Matrix. The rows represent the predicted classes and the columns represent the actual classes.

The Confusion Matrix is shown below:

Here is an explanation of the terms in the Confusion Matrix:

  • True Positive (TP): The predicted class is positive and it's true.
  • True Negative (TN): The predicted class is negative and it's true.
  • False Positive (FP): The predicted class is positive but it's false. This is known as Type I Error.
  • False Negative (FN): The predicted class is negative but it's false. This is known as Type II Error:

Hands-On Example

Now, let's look at a hands-on example of a Binary Classification problem where the results of the model should be visualized with a Confusion Matrix.

Suppose we have developed a Machine Learning model to classify images as cats or as dogs. In this example, we have the following two classes:

  • Positive: Cat
  • Negative: Dog

After training the model, we apply it to a set of test images to evaluate its performance. We have a total number of 40 test images, of which 26 are cats and 14 are dogs.

The Confusion Matrix for this classification task would look something like this:

You can view this post with the tier: Academy Membership

Join academy now to read the post and get access to the full library of premium posts for academy members only.

Join Academy Already have an account? Sign In