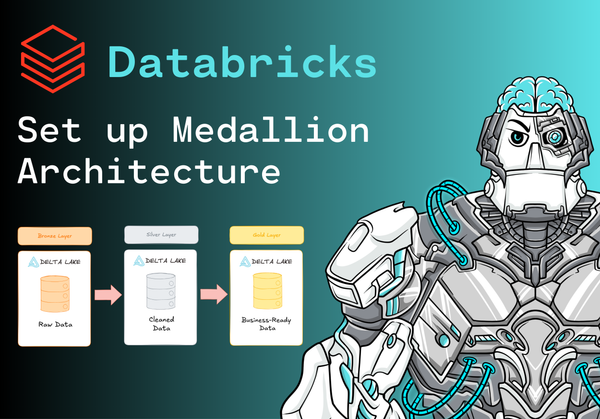
Set up Medallion Architecture in Databricks: From Raw Data to Gold Standard
📘 Introduction In the age of data-driven decision making, a well-structured and scalable data architecture is essential. The Medallion Architecture is a proven framework that organizes data into multiple layers of refinement — ensuring clarity, governance, and trust as data flows from raw ingestion to business-ready insights. When combined with Databricks and...


